Americans support more spending on water infrastructure
Many of President Donald Trump’s campaign promises and early moves in office have sparked controversy and highlighted deep divisions within the country. But one of Trump’s proposals–spending $1 trillion to fix the nation’s infrastructure–has broad, bipartisan support, according to numerous public opinion surveys. Water projects are only expected to be a small part of that potential infrastructure spending, but polling data suggests that the public is willing to pay for such improvements.
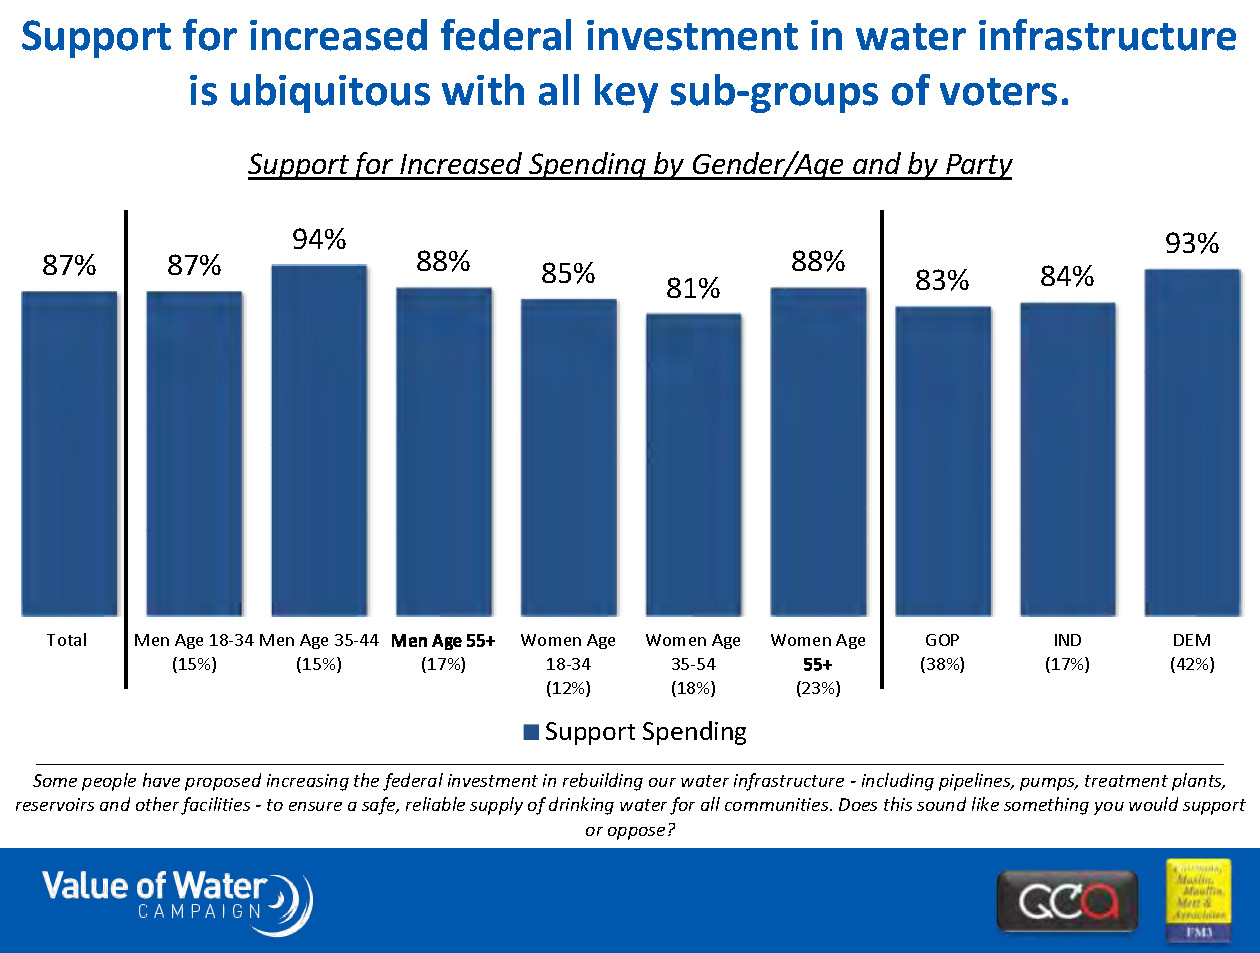
A poll released this week by the Value of Water Campaign found “overwhelming support for increasing federal investment in water infrastructure.” The graphic below shows just how broad-based that support is.
In their slide deck summarizing the results, pollsters Lori Weigel and Dave Metz offered the following takeaways from the Value of Water Campaign’s survey of 1,000 registered voters:
Voters say that rebuilding America’s infrastructure – particularly water infrastructure – is very important. Voters across the political spectrum say water infrastructure is very important for the President and Congress to address.
There is overwhelming support for increasing federal investment in water infrastructure, which cuts across party and demographic lines.
This is even more striking given that most think water infrastructure is in good shape. Views of water infrastructure have remained stable since last year.
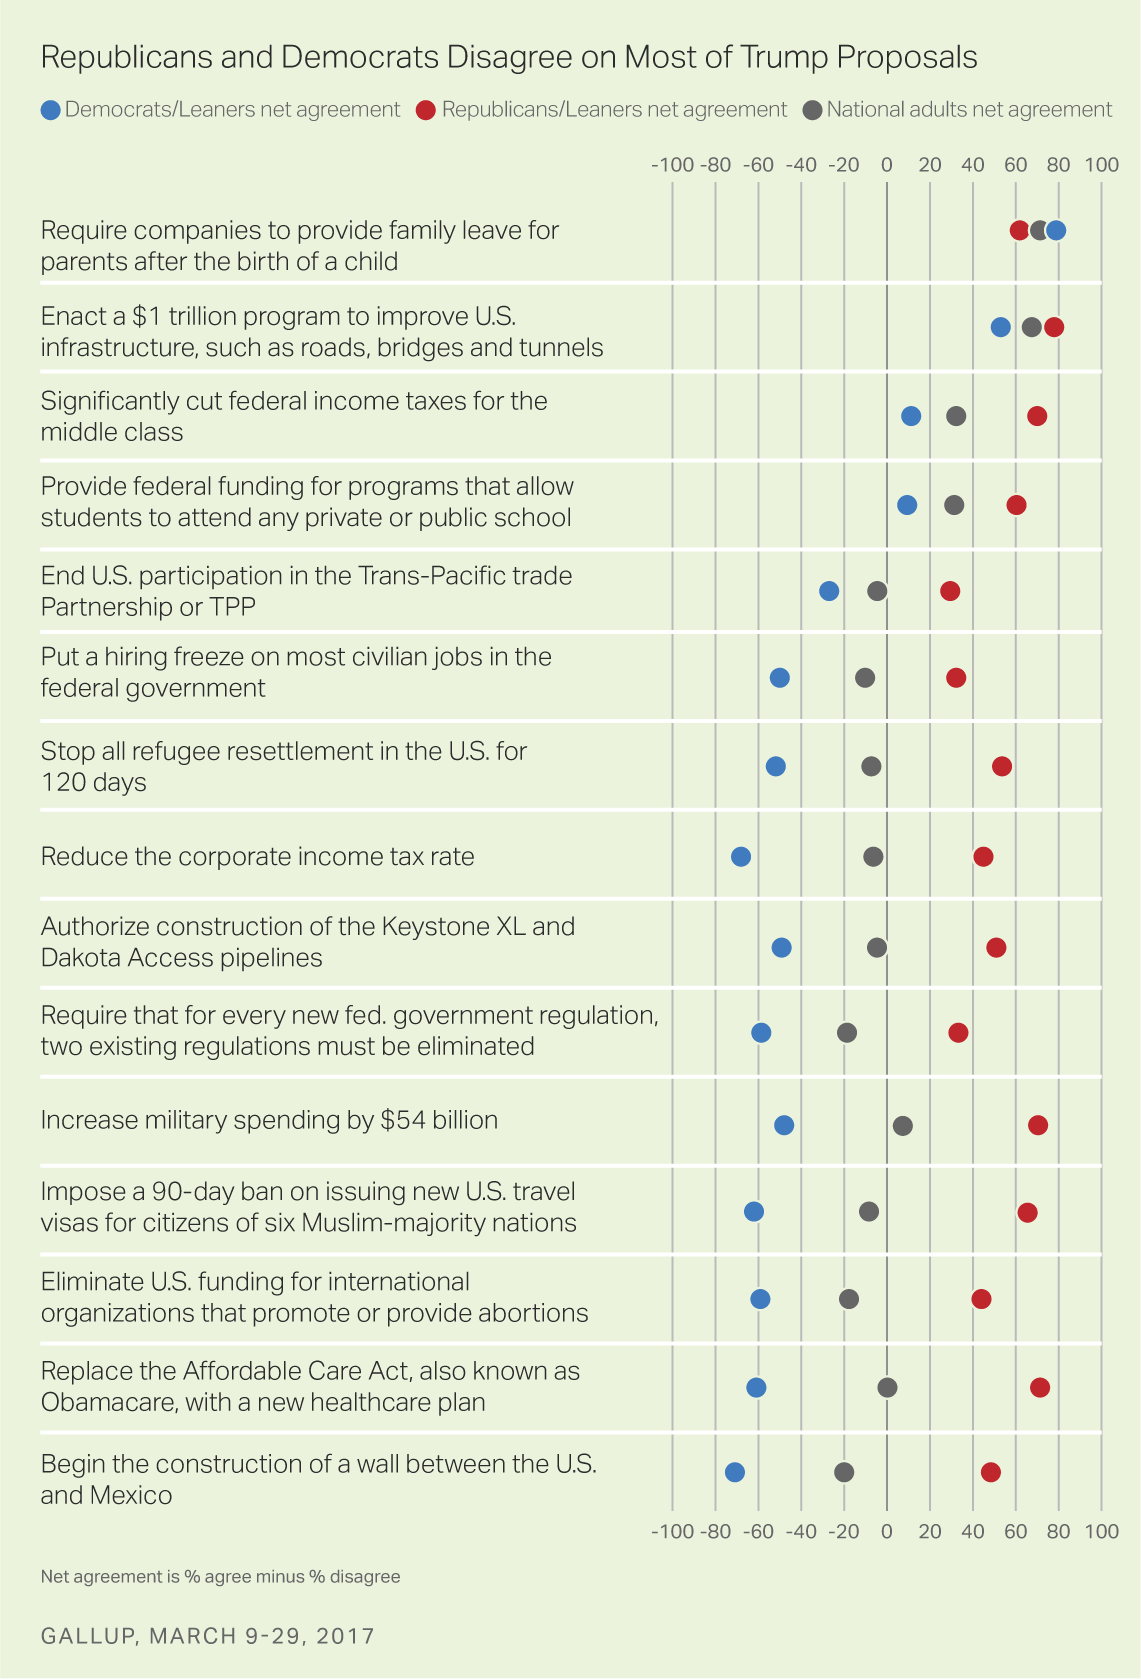
A March 2017 Gallup poll also found that both Republicans and Democrats favor infrastructure spending, broadly defined. The graphic below shows that only family leave had more bipartisan support than the $1 trillion infrastructure program that Trump proposed in the campaign. Aside from infrastructure and family leave, Trump’s other proposals trigger big partisan divisions between Republicans and Democrats.
In a separate January 2017 survey, Gallup found that 69% of Americans believe it’s “very important” for President Trump to keep his campaign promise of advancing major spending on infrastructure. That was the highest percentage of any of the promises that pollsters asked about.
As The New York Times reported in April, Trump is well aware of the popularity of infrastructure spending and even envisions it as a way to help pass other legislation:
Mr. Trump, speaking in a wide-ranging interview in the Oval Office on Wednesday, described the infrastructure package as a high-value legislative sweetener that he could attach to a revived Affordable Care Act repeal bill or tax code overhaul to attract bipartisan support that thus far he had neither sought nor received.
“Infrastructure is so popular that I might want to use it for another bill,” said Mr. Trump, who is in need of a legislative win after the humbling defeat of his health care bill last month. “Infrastructure is so popular with the Democrats and pretty popular with the Republicans. A lot of Republicans want infrastructure, too.”
Global poll finds widespread dissatisfaction with infrastructure
Other surveys have probed Americans’ opinions on a variety of infrastructure. One example is a global survey conducted in 2016 by Ipsos. This poll in 26 countries sought to “obtain a pulse on satisfaction levels related to roads, rail, air networks, utilities, and broadband communications.” In the United States, 63% of respondents said they weren’t satisfied with their infrastructure, and they ranked water and sewage systems as their top priorities. The graphic below from Ipsos summarizes the results.
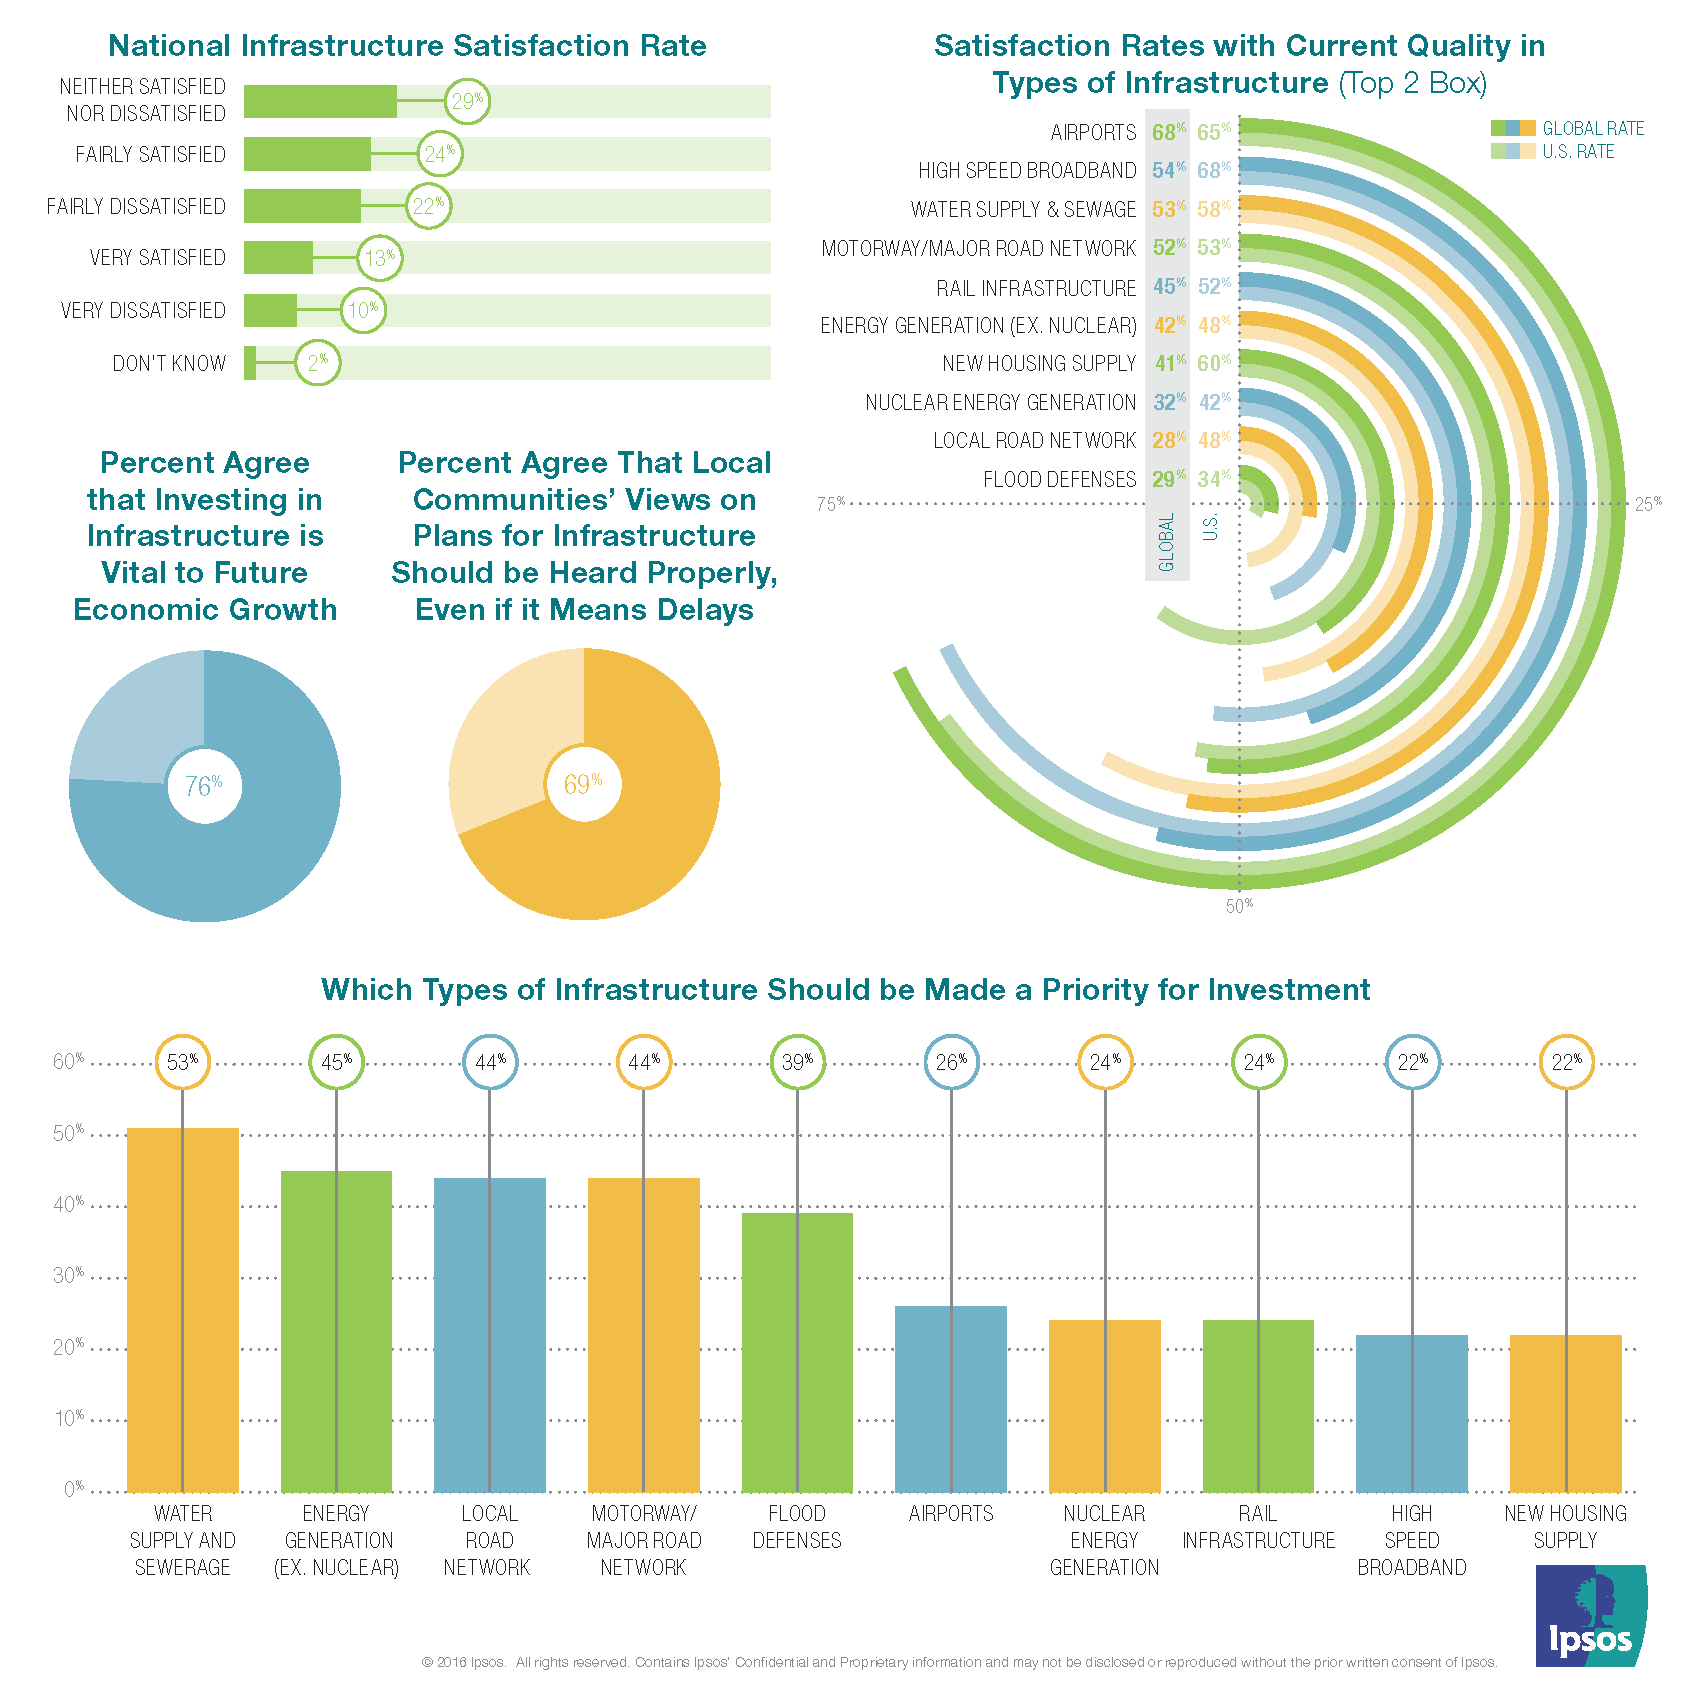
“Americans prioritize water system, road and energy infrastructure as their preferred focus for development,” Ipsos reported. The poll also found that 76% of Americans believe investing in infrastructure is vital to future economic growth and 69% think community views on projects should be heard properly, even if it means delays.
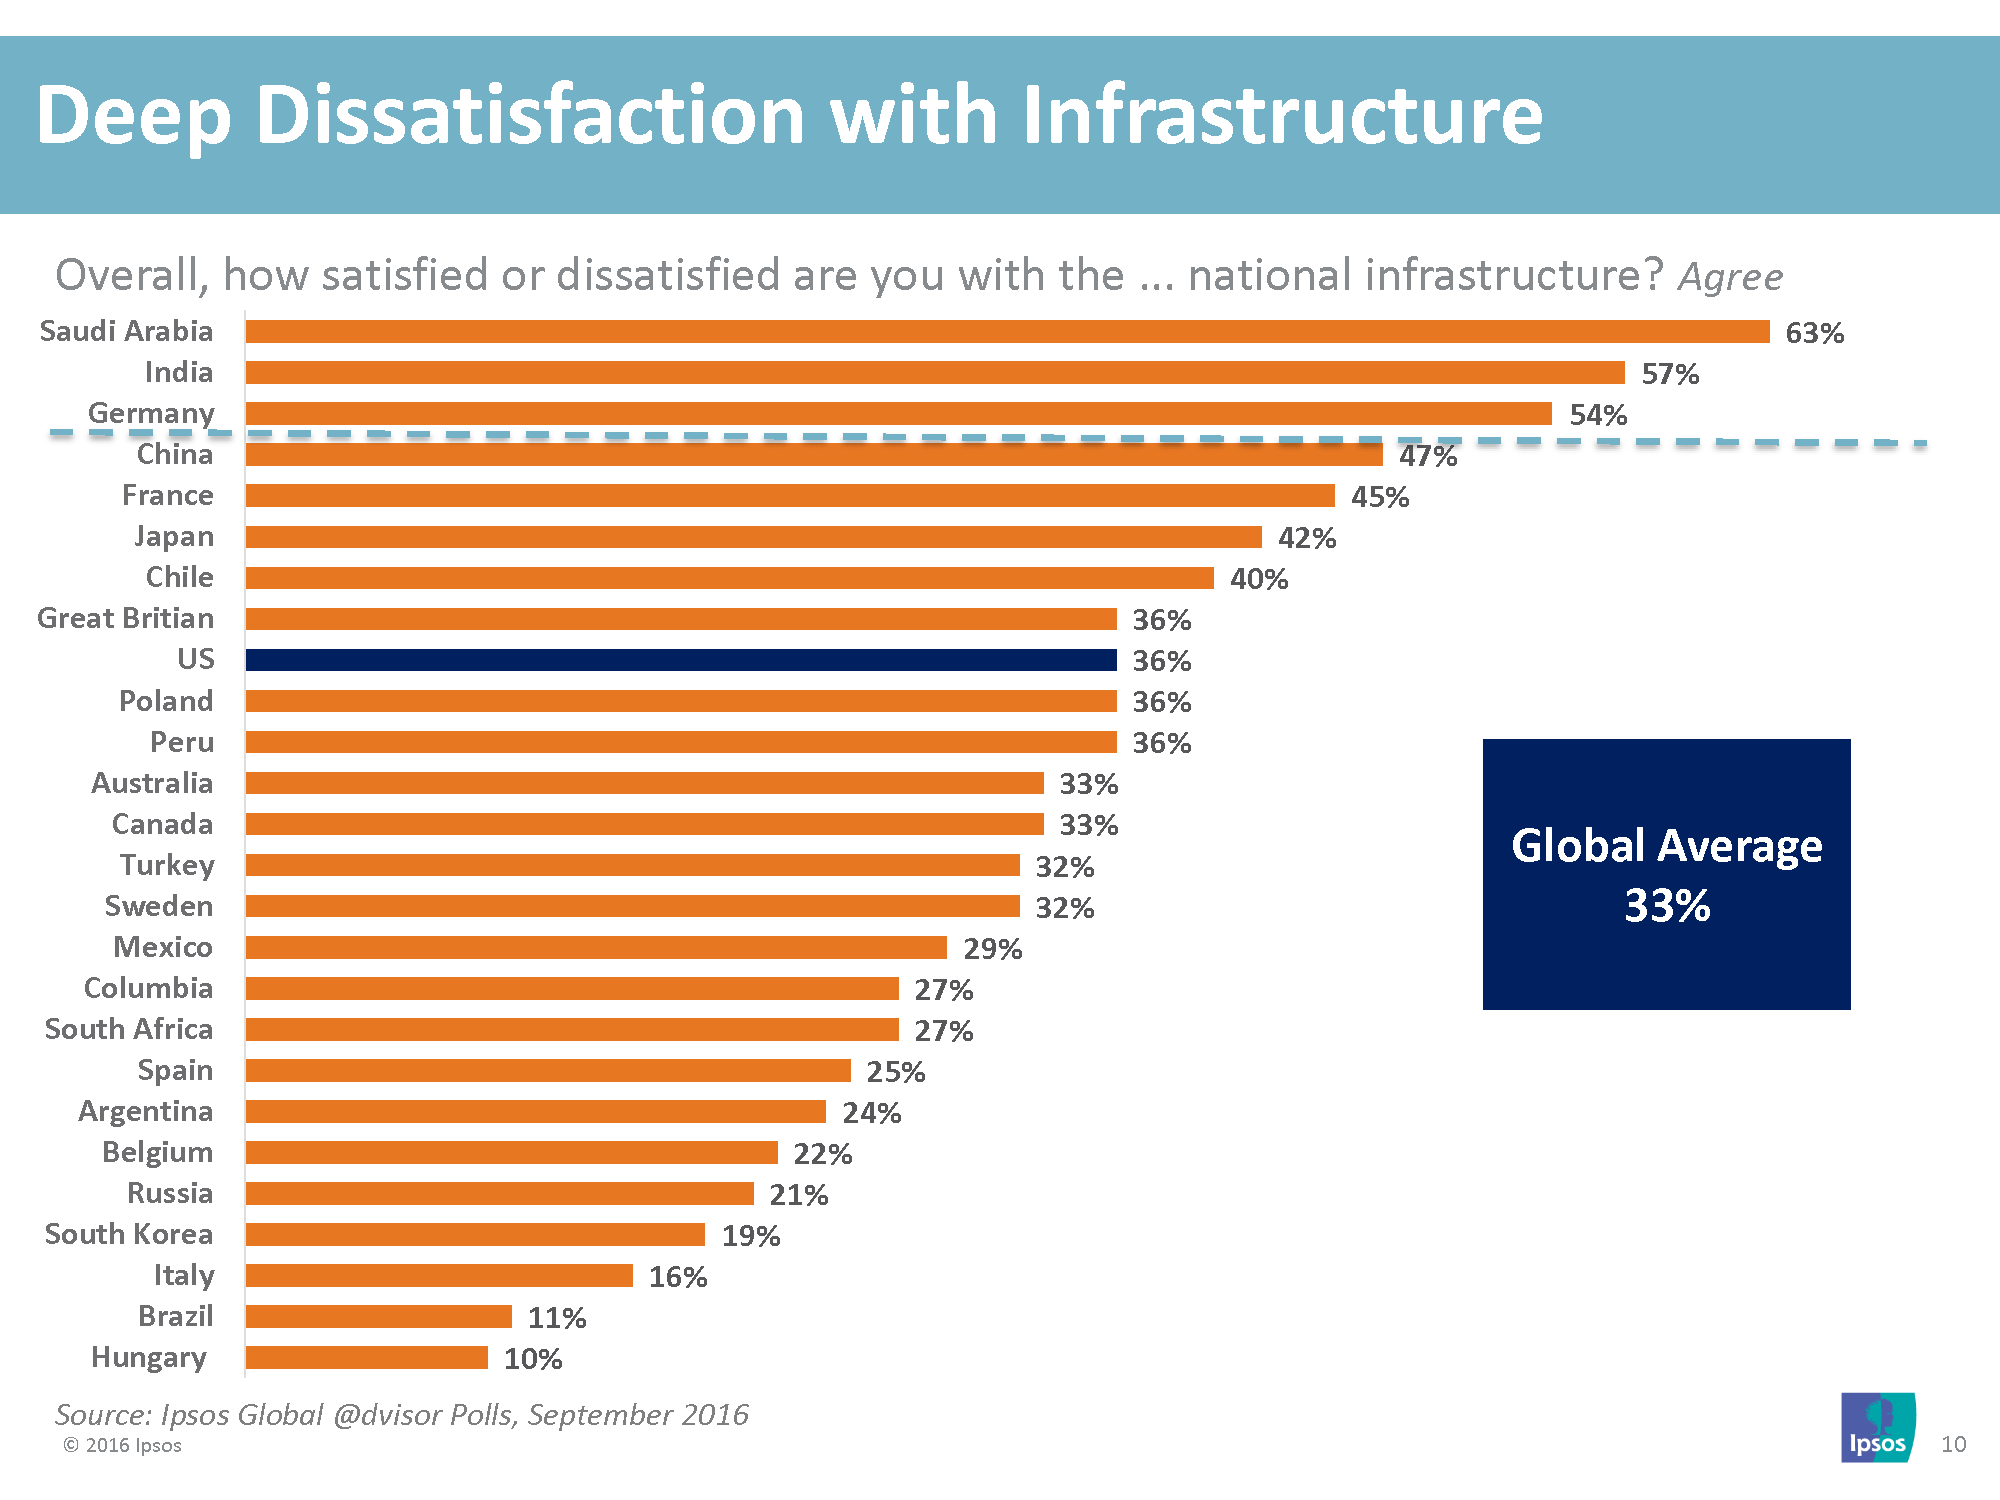
Looking across the globe, many citizens aren’t so thrilled with the state of the infrastructure they rely on. The graphic below shows that the satisfaction rate averaged only 33% across the 26 countries surveyed.
The word “infrastructure” means different things to people, so when looking at polls on the issue, it’s important to understand what, exactly, pollsters are asking about. In the Ipsos survey, pollsters actually questioned people about what infrastructure means to them. The graphic below, a word cloud that sizes the terms according to how frequently they were offered, shows that water-related infrastructure doesn’t exactly spring to mind for many people.
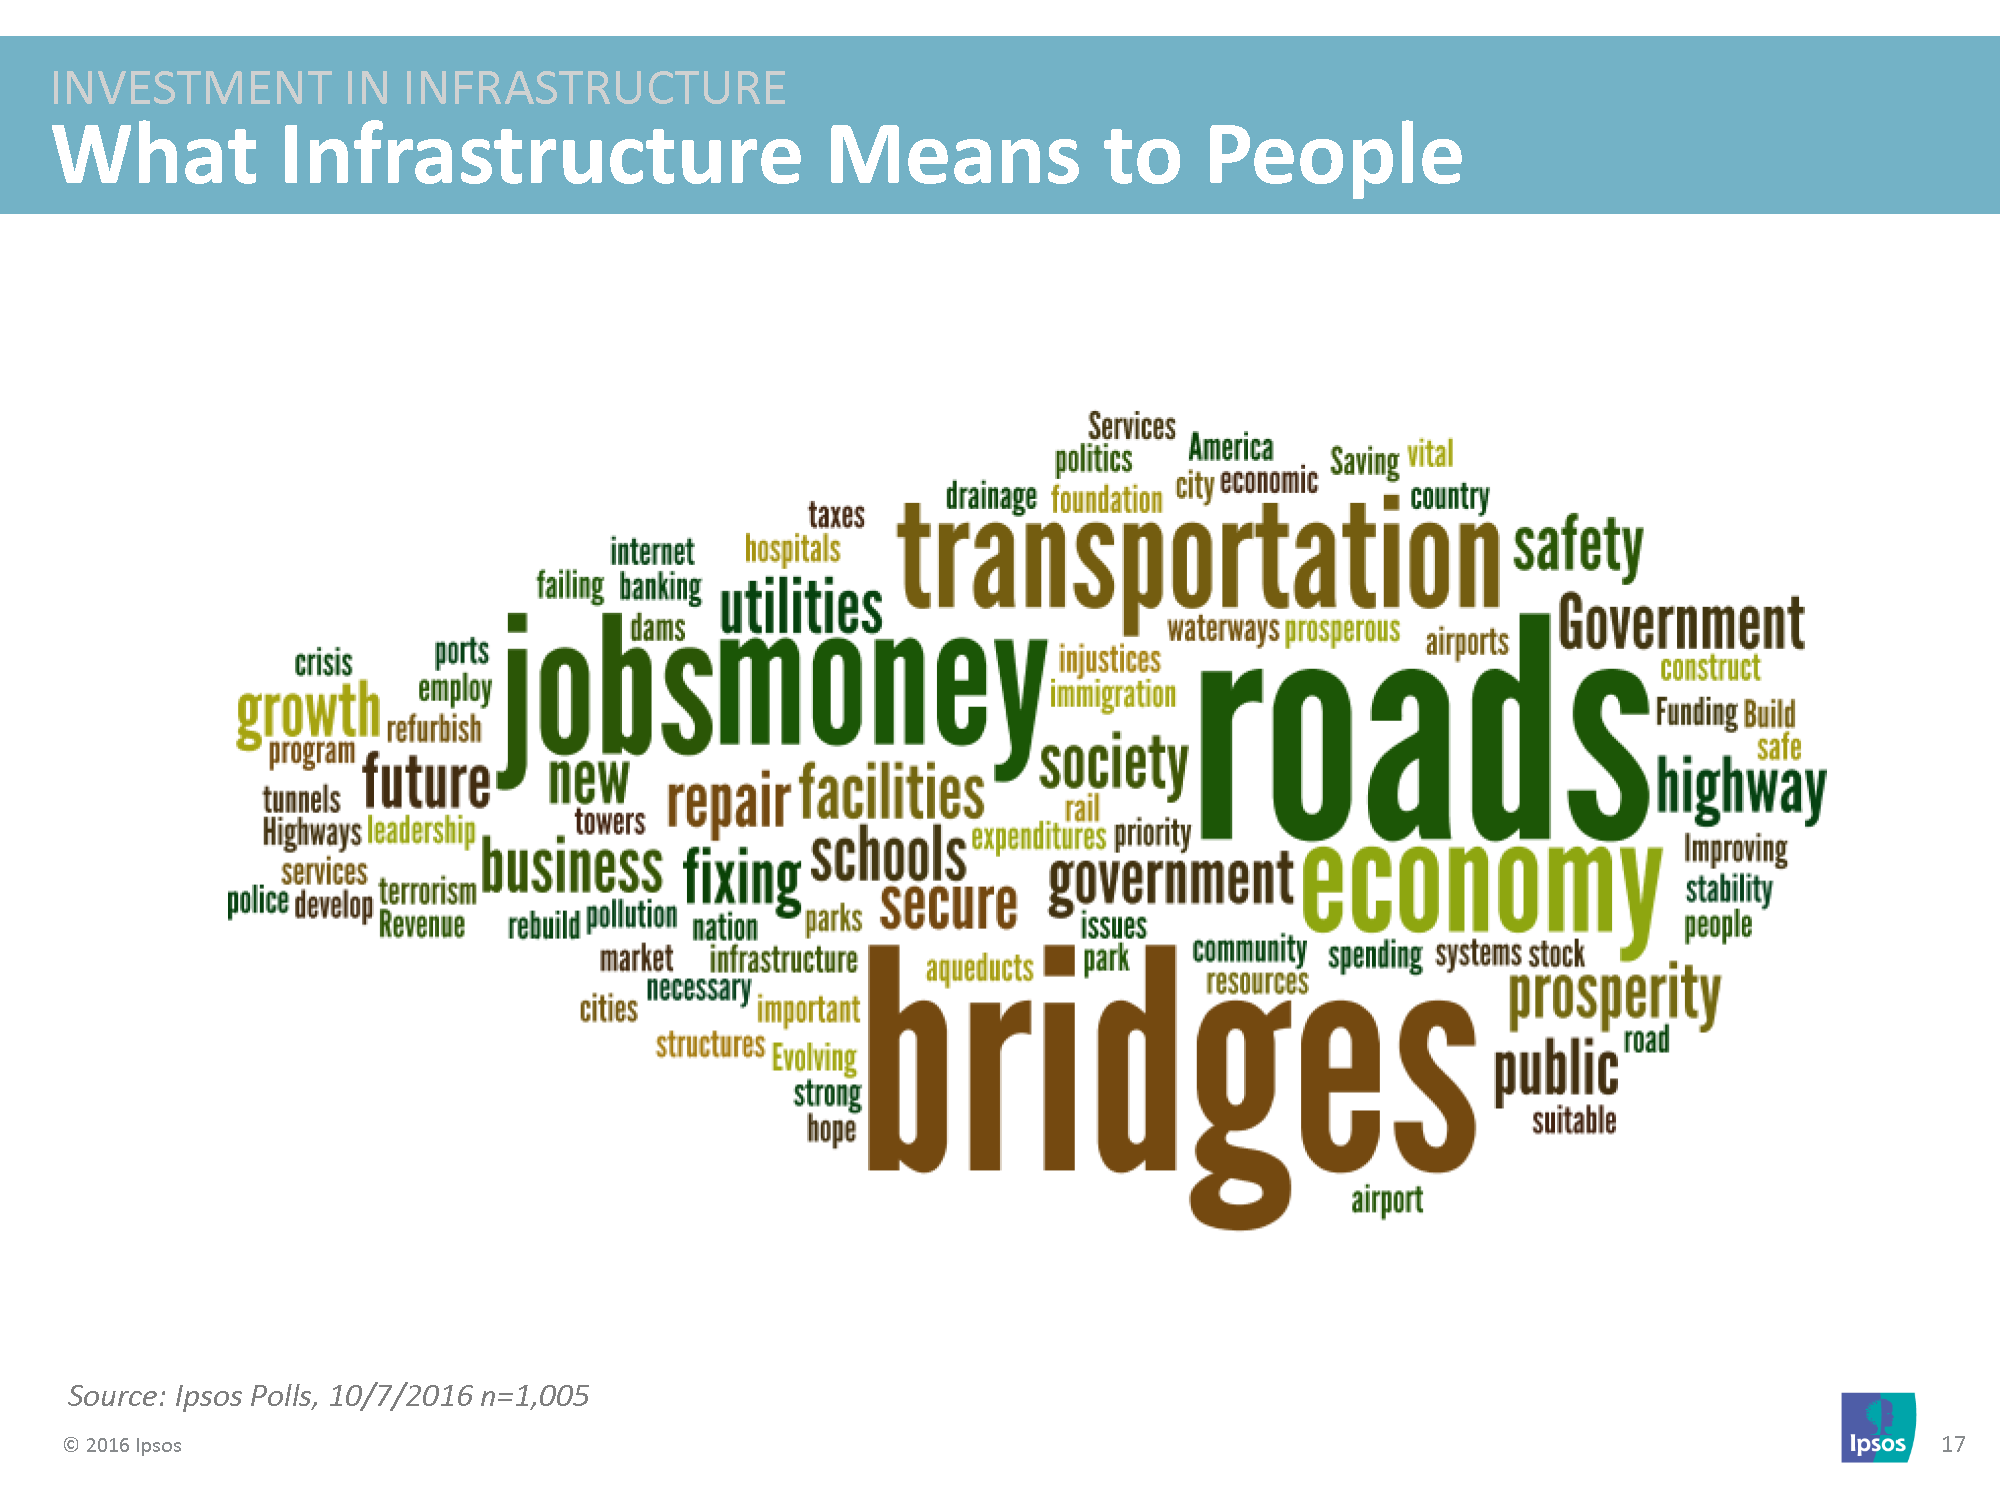
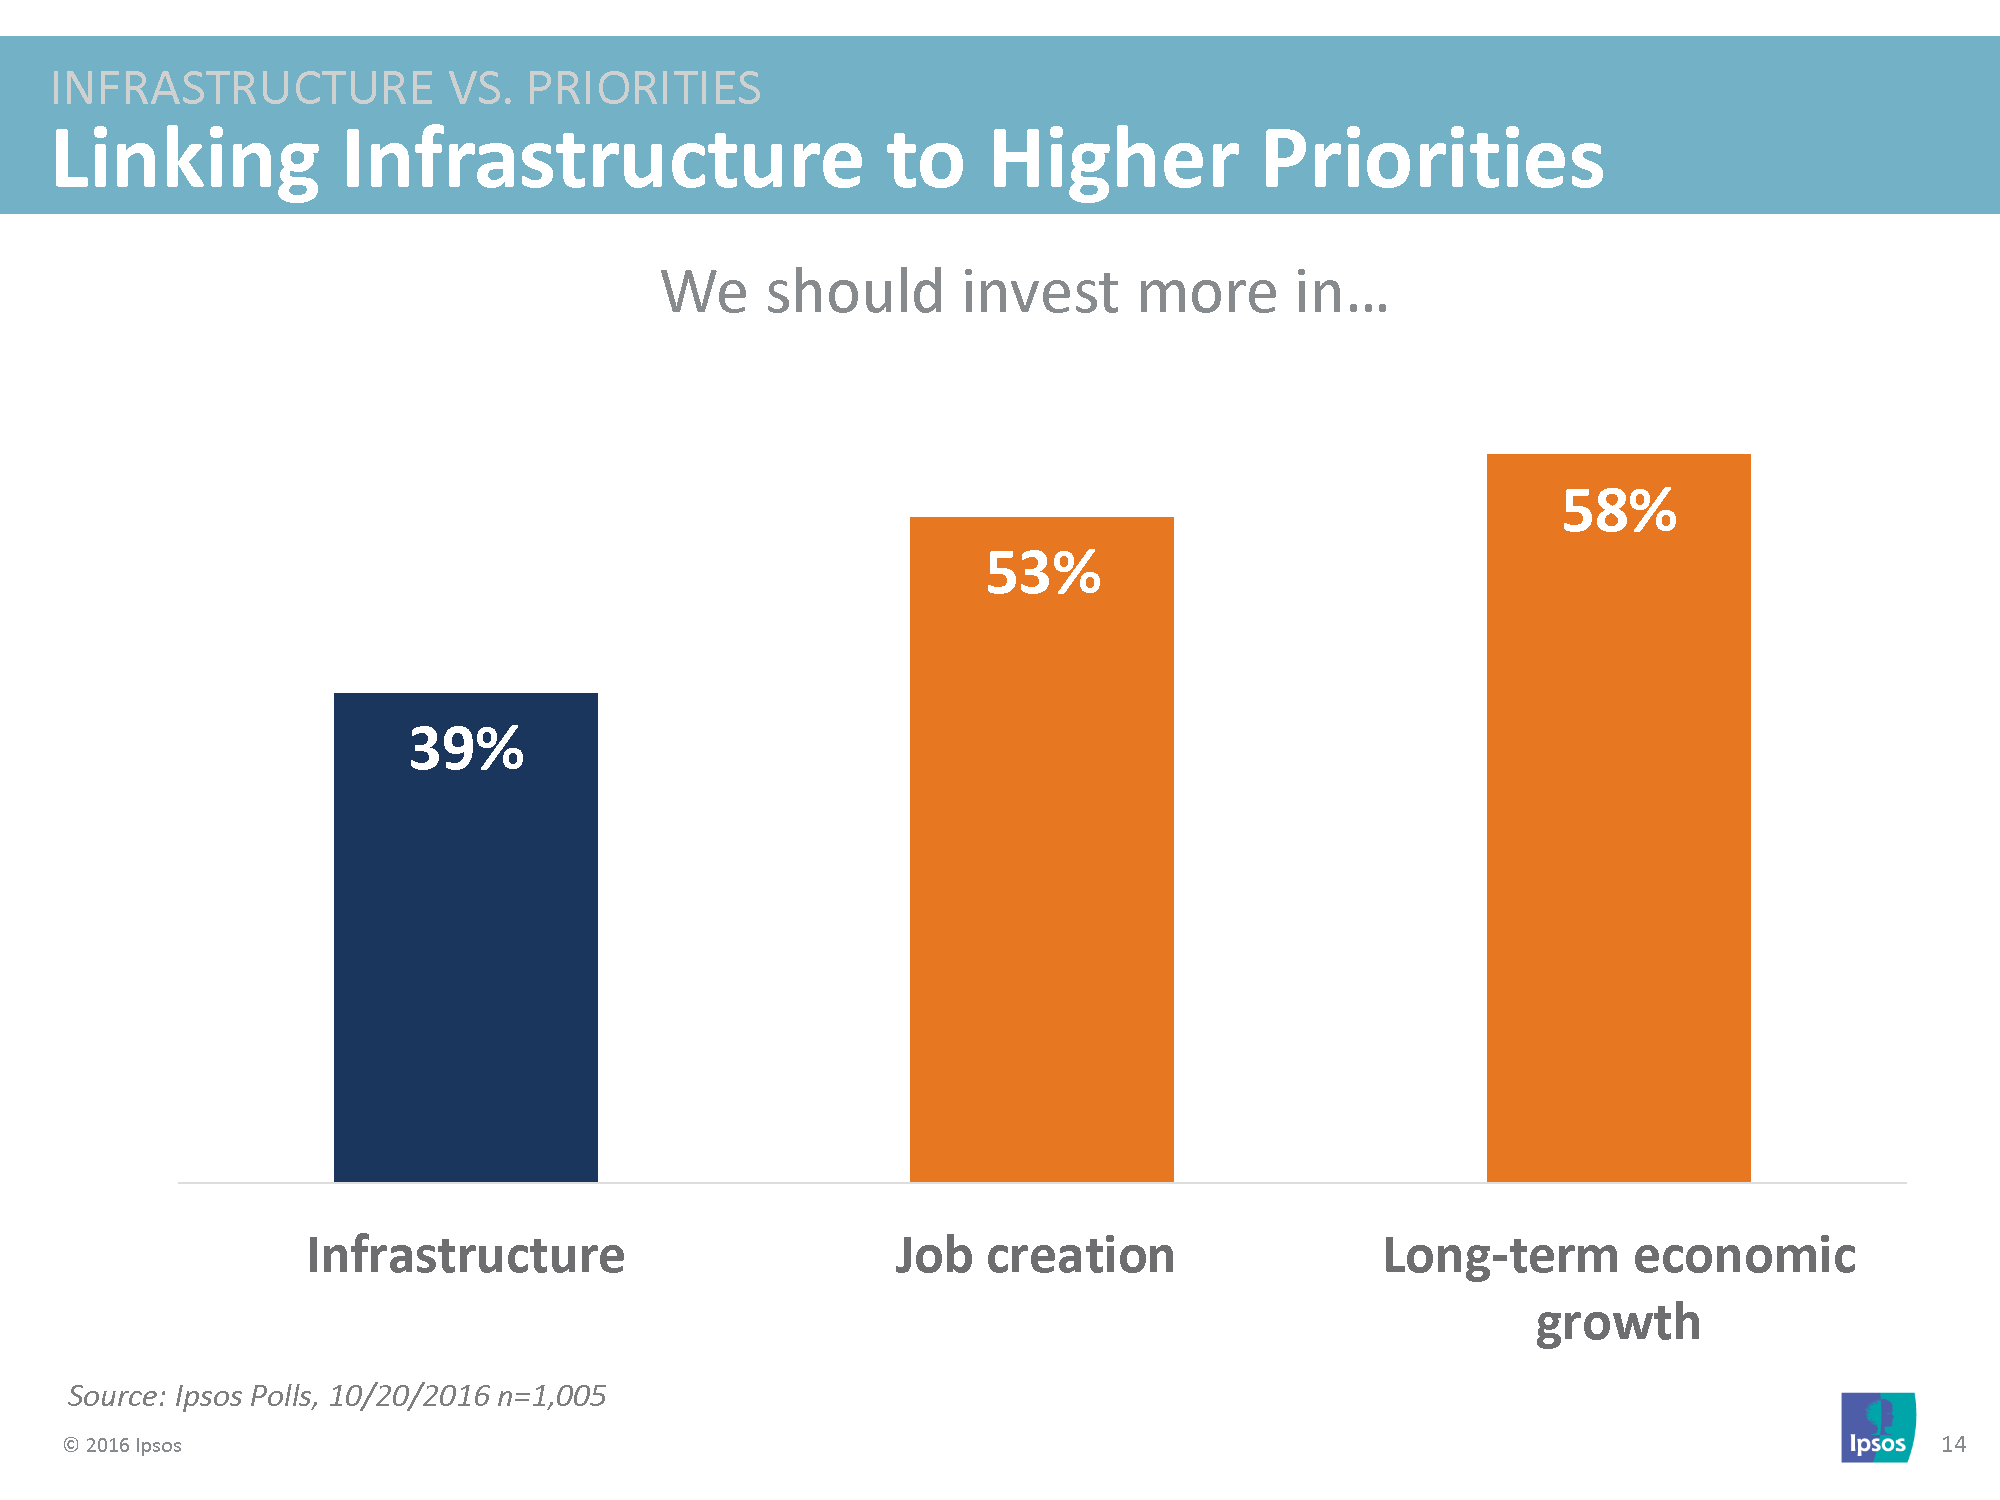
In his informative presentation, Ipsos pollster Cliff Young notes that roads, bridges, and jobs may be the first ideas that people think of when asked about infrastructure, but people also express concern about water and energy systems when prompted by surveyors (as the Value of Water Campaign’s poll also demonstrates). Young argues that infrastructure advocates could help their cause by linking the issue to other higher-priority concerns, such as employment and economic security. As shown below, framing infrastructure spending as a way to create jobs and pave the way for higher long-term growth can hitch the issue to even more popular ideas.
Polls focused on water infrastructure
I’ve found two other recent U.S. polls that focus specifically on water-related infrastructure (please ping me if you know of others). As I cover in some earlier posts, last year’s survey by the Value of Water Campaign and a separate poll by MWH Stantec both found high levels of concern about water works–and a willingness to pay for infrastructure fixes.
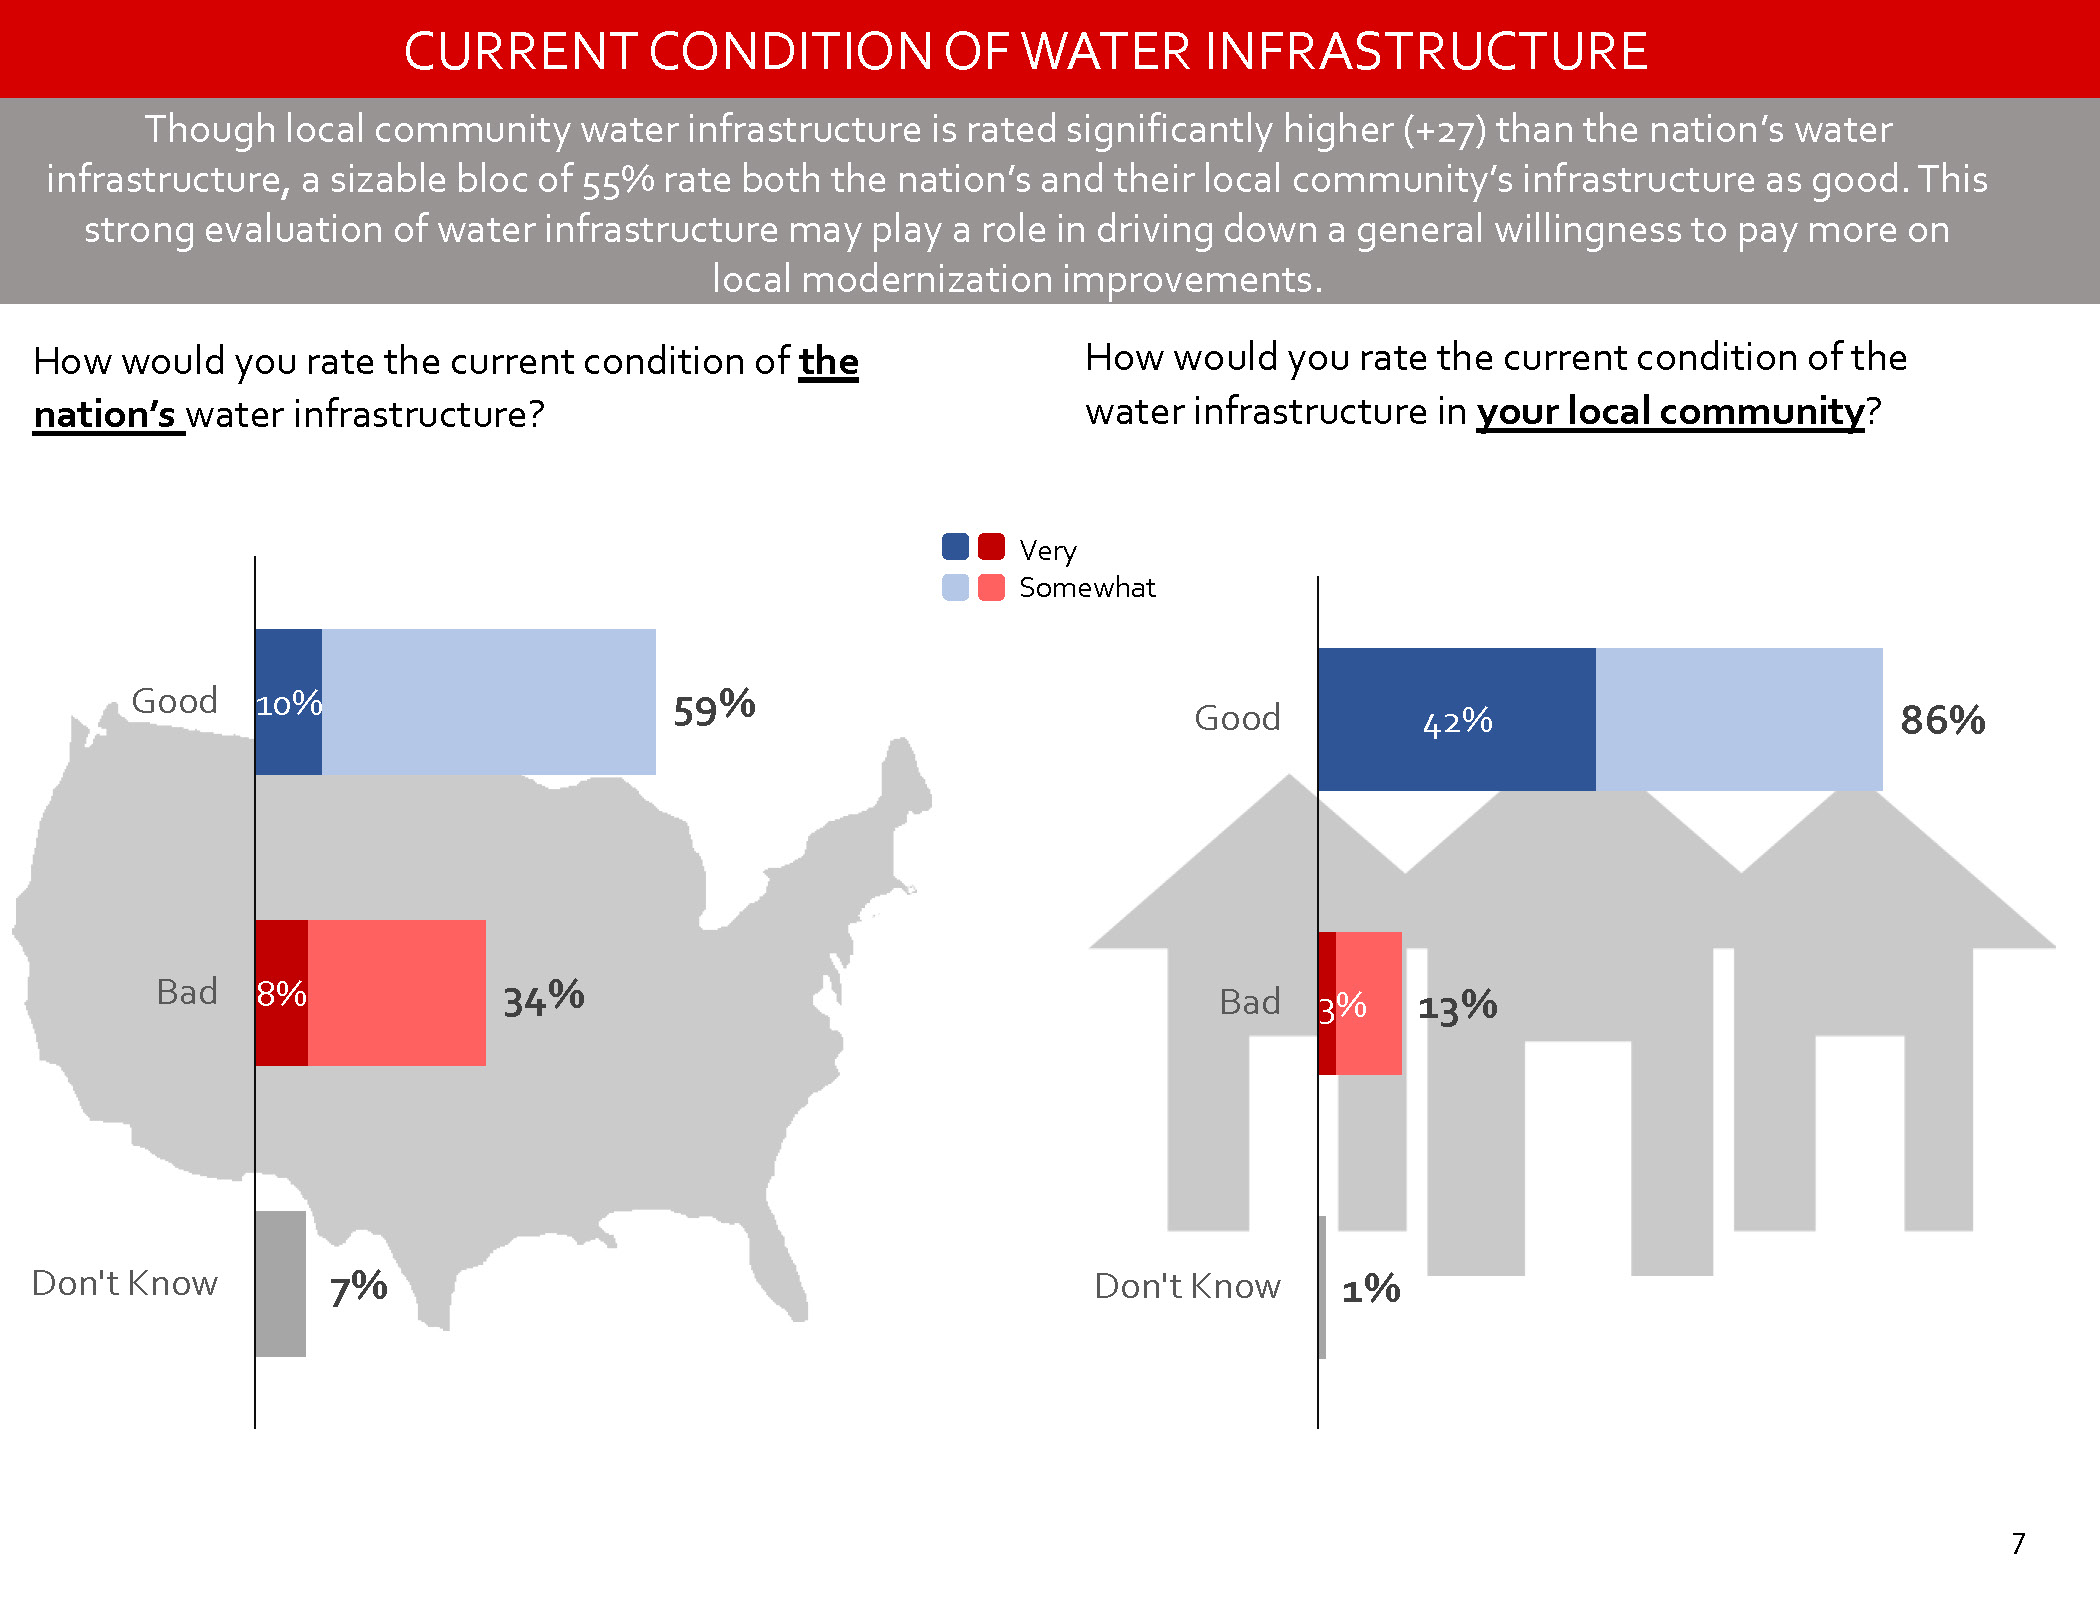
The graphic below, from last year’s survey by the Value of Water Campaign, shows that 34% of respondents said the nation’s water infrastructure is in very bad or somewhat bad condition. But when asked about the infrastructure in their own community, people had a much more favorable view. Only 13% of those surveyed said their local water works were in very bad or somewhat bad condition. This year’s survey generated similar results.
The finding that people are more negative about water infrastructure, writ large, than their own local water system isn’t all that surprising. A similar phenomenon exists with polling on Congress: the public gives dismal approval ratings to the institution and its members, but when asked about their own representative’s performance, the responses tend to be more positive.
With water infrastructure, high-profile incidents, such as the lead poisoning in Flint and the crumbling spillways at California’s Oroville Dam, have generated plenty of bad press that can affect overall public opinion. But when asked about their own water supply, odds are that respondents haven’t experienced or heard about any major problems recently.
$1 trillion needed for water infrastructure
Who will pay for infrastructure projects remains an open question and will depend on the nature of the project, but it appears likely that many Americans will be watching their water bills rise to help fund the work, even if the federal government steps up its commitment.
Circle of Blue’s helpful tracking of water pricing has already found water bills are up 48% since 2010 in 30 major cities. The American Water Works Association says the country faces a $1 trillion tab for fixing and upgrading its water infrastructure over the next quarter century. If the projected cost increases occur, researchers estimate that water bills could become unaffordable to millions of Americans:
…while water rates remain comparatively affordable for many U.S. households, this trend will not continue in the future. If water rates rise at projected amounts over the next five years, conservative projections estimate that the percentage of U.S. households who will find water bills unaffordable could triple from 11.9% to 35.6%. This is a concern due to the cascading economic impacts associated with widespread affordability issues; these issues mean that utility providers could have fewer customers over which to spread the large fixed costs of water service.
Sarah Frostenson at Vox covers the research in this piece, which included the graphic below showing which census tracts are at higher risk of losing affordable drinking water.
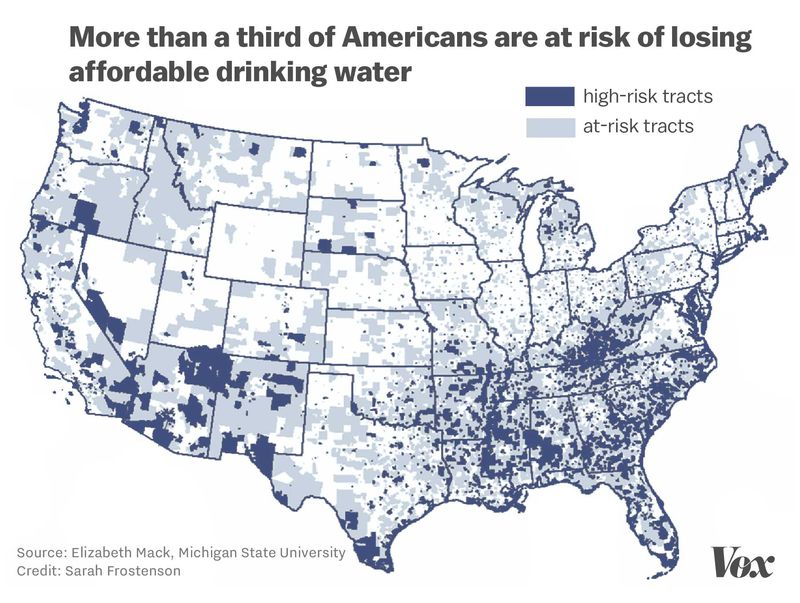
Source: Sara Frostenson, Vox
If pollsters asked people about paying three times as much for their water to fund infrastructure, we’d probably hear less enthusiasm for the idea. If an infrastructure package actually does come together in Washington, hopefully we’ll see more detailed polling on the critical question of cost.
Ordinarily, an issue like infrastructure with such strong, bipartisan backing would seem to be a likely candidate for progress. But given the tumult in D.C., it’s anyone’s guess whether that public support will translate into more work rehabilitating and expanding the nation’s infrastructure.
Resources
- “Value of Water Campaign National Public Opinion Poll,” May 2017
- “Trump Family Leave, Infrastructure Proposals Widely Popular,” Gallup, April 7, 2017
- “Infrastructure Spending Deemed Most Important Trump Promise,” Gallup, January 20, 2017
- “Trump Weighs Infrastructure Bill but Keeps New York Up in the Air,” The New York Times, April 5, 2017
- “National Infrastructure: Public Satisfaction & Priorities,” Fall 2016 Ipsos Survey
- “Public Opinion & The Infrastructure Agenda,” Ipsos Ideas Spotlight, October 25, 2016
- “America has a water crisis no one is talking about,” Vox, May 9, 2017
- “Infrastructure Report Card,” American Society of Civil Engineers
- “A Burgeoning Crisis? A Nationwide Assessment of the Geography of Water Affordability in the United States,” PLOS ONE, January 11, 2017.
WaterPolls.org aggregates, analyzes, and visualizes public opinion data on water-related issues. Stay informed via Twitter, Facebook, Pinterest, RSS, and email.


